

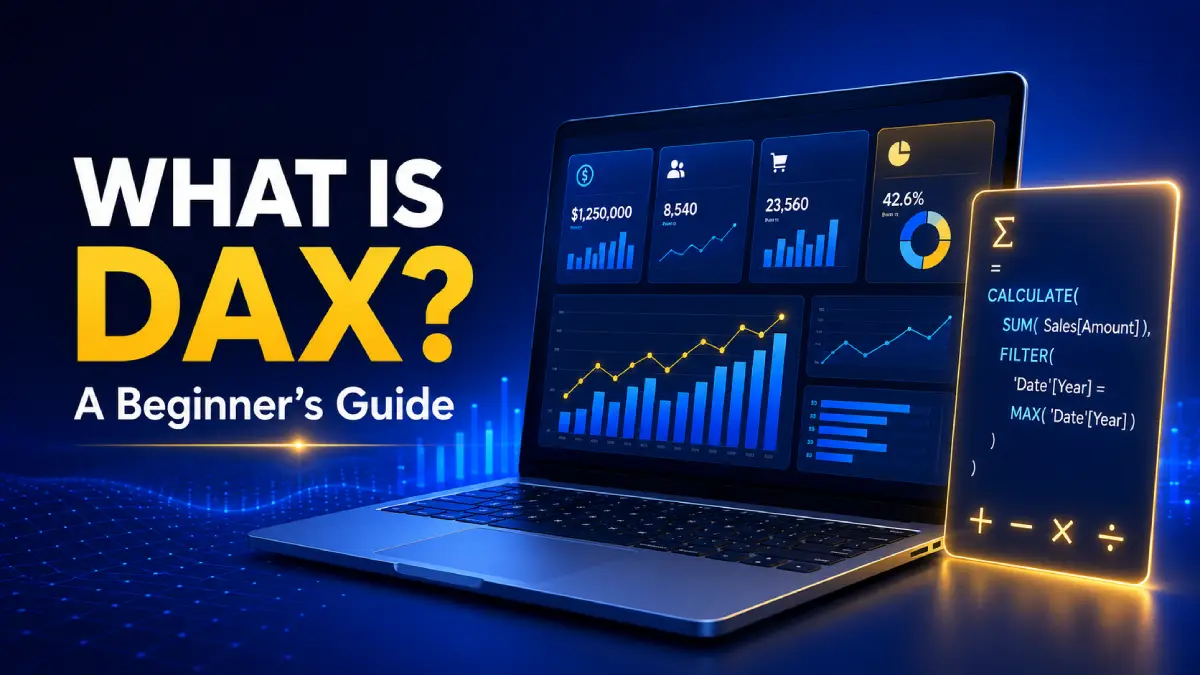
Here’s something many beginners discover after spending a little time in Power BI: drag-and-drop can only take you so far.
Sooner or later, you need a number that doesn’t already exist in your data. You may want to compare this month’s sales with the same month last year, calculate profit margins, show a running total, or find each product’s percentage of total revenue.
That is where DAX comes in.
DAX stands for Data Analysis Expressions. It is the formula language used in Power BI and other Microsoft tabular data models to create custom calculations from existing data.
At first, DAX can look intimidating. However, you don’t need to learn hundreds of functions before it becomes useful. If you understand measures, calculated columns, and context, you already have a strong foundation.
What Does DAX Actually Do?
DAX helps you create new information from data already stored in your model.
For example, a sales table may contain order dates, product names, quantities, revenue, and costs. It may not contain total profit, year-to-date revenue, or year-over-year growth. DAX lets you calculate those values without changing the original source data.
A simple DAX measure looks like this:
Total Revenue =
SUM(Sales[Revenue])
This formula adds the values in the Revenue column. What makes the measure useful is that its result changes according to the current report filters.
If someone selects the East region, the measure shows revenue for the East region. If they also select 2026, it shows East-region revenue for 2026. You write the measure once, and Power BI evaluates it for the current report context.
Where Is DAX Used?
DAX is part of Microsoft’s tabular data-modeling ecosystem. You will commonly encounter it in:
| Product | Where DAX is used |
|---|---|
| Power BI | Measures, calculated columns, calculated tables, queries, and security rules |
| Excel Power Pivot | Calculations inside the workbook’s data model |
| SQL Server Analysis Services | Enterprise tabular models |
| Azure Analysis Services | Cloud-based tabular models |
For most beginners, Power BI is the main place to learn DAX. You don’t download it separately. You write its formulas inside a supported Microsoft product.
What Can You Build With DAX?
Measures
A measure is a calculation evaluated according to the current filter context.
Place [Total Revenue] in a card, and it may show company-wide revenue. Put the same measure in a table beside product names, and it shows revenue for each product. Add a region slicer, and the results adjust to the selected region.
The formula stays the same. The context changes.
Measures are normally the right choice for totals, averages, ratios, percentages, comparisons, and other results that should respond to report filters.
Calculated Columns
A calculated column adds a new column to a model table. Its formula is normally evaluated one row at a time.
Profit =
Sales[Revenue] - Sales[Cost]
In a standard Power BI Import model, these results are calculated during data refresh and stored in the model. They do not change merely because someone clicks a slicer.
Calculated columns are useful when you need a row-level value for grouping, sorting, filtering, or another model operation. Because stored columns can increase model size, they should not automatically replace measures.
Calculated Tables
DAX can also create a table from data already in the model. Calculated tables can help in certain modeling scenarios, such as creating a date table or a supporting summary table.
Beginners do not need to master calculated tables immediately, but it is useful to know that DAX is not limited to measures and columns.
Time-Intelligence Calculations
DAX includes functions for calculating year-to-date sales, previous-month revenue, the same period last year, and year-over-year growth.
Sales YTD =
TOTALYTD(
    [Total Revenue],
    'Date'[Date]
)
For reliable time-intelligence results, your model needs an appropriate date table connected to the relevant fact table. For classic time intelligence, its date column should contain unique, contiguous dates without blank values. Depending on the model, you may also need to mark it as the date table.
Row-Level Security
DAX expressions can help define row-level security rules. For example, a model can restrict regional managers to the rows for their assigned regions.
DAX defines the filtering logic. Roles, user assignments, relationships, and permissions are configured and managed through Power BI or Analysis Services.
The Concept That Makes DAX Work: Context
Unexpected results often come from misunderstanding context. Two types matter most to beginners: filter context and row context.
Filter Context
Filter context is the set of filters applied when a measure is evaluated. It can come from:
- Slicers
- Report, page, or visual filters
- Rows and columns in a visual
- Selections in other visuals
- Relationships between model tables
- Filters added or changed inside a DAX formula
If a report has Country = USA and Year = 2026 selected, [Total Revenue] is evaluated using the rows allowed by that context. The measure is not permanently storing USA revenue for 2026. It calculates the result using the active filters.
Row Context
Row context means DAX is evaluating an expression for the current row. It is common in calculated columns and iterator functions such as SUMX().
In the Profit calculated column above, DAX uses the revenue and cost from each current row. Filter context and row context are related, but they are not the same. Understanding that difference prevents many beginner mistakes.
DAX vs. Excel Formulas
DAX looks familiar if you have used Excel, but the two formula languages work in different environments.
| Area | Excel formulas | DAX |
|---|---|---|
| Main structure | Cells and ranges | Tables, columns, relationships, and measures |
| Location | Worksheet | Tabular data model |
| Typical reference | A1:A10 |
Sales[Revenue] |
| Context | Mainly cell references and worksheet logic | Measures respond to model filter context |
| Common use | Spreadsheet calculations | Reusable analytics across report visuals |
Excel formulas are not necessarily static. They recalculate when referenced values change, and functions such as SUBTOTAL() can respond to filtered rows. The key difference is that a DAX measure is designed to work with filter context across a relational data model.
Knowing Excel formulas makes the syntax more familiar, but DAX requires a different way of thinking about tables, relationships, and context.
Five Useful DAX Functions to Learn First
| Function | What it does | Why it is useful |
|---|---|---|
SUM() |
Adds the numbers in a column | Useful for totals such as sales and cost |
DIVIDE() |
Divides two values safely | Handles division-by-zero cases cleanly |
CALCULATE() |
Evaluates an expression in a modified filter context | Essential for comparisons and filtered totals |
FILTER() |
Returns rows that meet a condition | Supports more detailed filtering logic |
RELATED() |
Retrieves a value from a related table | Helps with row-context calculations across relationships |
Time-intelligence functions such as TOTALYTD() and SAMEPERIODLASTYEAR() are valuable too, but learn them after setting up a proper date table.
Why Is CALCULATE Important?
CALCULATE() lets you evaluate an expression under a modified filter context.
Online Revenue =
CALCULATE(
    [Total Revenue],
    Sales[Channel] = "Online"
)
This measure starts with [Total Revenue] and applies a filter for online sales. Other compatible filters in the report can still affect the result.
You do not need to master every CALCULATE() behavior on day one. Start with simple filtered measures and build from there.
A Simple DAX Example You Can Try
Assume your model contains a Sales table with Revenue and Cost columns. Create these measures:
Total Revenue =
SUM(Sales[Revenue])
Total Cost =
SUM(Sales[Cost])Total Profit =
[Total Revenue] - [Total Cost]Profit Margin % =
DIVIDE(
[Total Profit],
[Total Revenue]
)Format Profit Margin % as a percentage. Add the measures to a table or matrix with product, region, or month. When you change the fields or use a slicer, Power BI evaluates them for each new context.
This small exercise demonstrates why measures are reusable and why filter context matters.
Measures vs. Calculated Columns
| If you need… | Usually choose… |
|---|---|
| A total, ratio, average, or KPI that responds to filters | Measure |
| A fixed value for every row | Calculated column |
| A value used to group or categorize rows | Calculated column |
| A percentage of the currently visible total | Measure |
| A result displayed in a card or chart | Measure |
| A field used as the “one” side of a relationship | A suitable model column, not a measure |
This is a practical starting point, not an absolute rule. Storage mode, source system, model design, and performance requirements can influence the final decision.
Common DAX Mistakes Beginners Make
Using a Calculated Column When a Measure Is Needed
If a result should change when users interact with the report, it will usually need to be a measure. Unnecessary calculated columns in an Import model can make the model larger and add refresh work.
Ignoring the Date Table
Time-intelligence formulas depend on correct date modeling. Make sure the date table is complete, connected properly, and suitable for the type of time intelligence you are using.
Confusing Row Context With Filter Context
A calculated column has row context, but that does not automatically give it the same filter context as a measure. Learn both concepts separately before moving into context transition and advanced uses of CALCULATE().
Writing One Huge Formula
Long formulas are difficult to test and maintain. Build smaller base measures and reference them in advanced measures. [Profit Margin %] is easier to understand when it uses [Total Profit] and [Total Revenue] instead of repeating every calculation.
Trying to Repair Bad Data With DAX
DAX is a calculation language, not a complete data-cleaning solution. Use the source system or Power Query to correct data types, remove errors, and reshape tables when appropriate.
Blaming DAX for Every Performance Problem
DAX can work efficiently with large tabular models, but no formula is guaranteed to remain fast across millions of rows. Performance also depends on table structure, relationships, column cardinality, storage mode, visual design, and calculation complexity.
Who Should Learn DAX?
DAX is worth learning if you:
- Build Power BI reports beyond simple totals
- Need custom KPIs or business metrics
- Compare current and previous reporting periods
- Calculate percentages, rankings, targets, or running totals
- Work with Power Pivot or Analysis Services tabular models
- Want stronger Power BI modeling and analysis skills
You do not need to master DAX before creating your first Power BI report. Learn how tables, relationships, visuals, and filters work first. Then begin with simple measures based on real business questions.
DAX is specific to Microsoft’s tabular ecosystem. Other BI platforms use different calculation languages, even when they solve similar reporting problems.
Common Myths About DAX
“DAX Is Only for Developers”
DAX is used by analysts, report developers, data modelers, and BI professionals. Its syntax can resemble Excel, although its context behavior requires additional practice.
“I Must Learn SQL Before DAX”
SQL and DAX solve different problems. SQL commonly retrieves and transforms database data. DAX performs calculations over a tabular model. SQL is useful, but it is not a prerequisite for learning DAX.
“DAX Is Always Slow on Large Data”
Well-designed tabular models can analyze large volumes efficiently. Poor model design or expensive formulas can still cause slow reports, so performance depends on more than row count.
“Every Power BI Report Needs DAX”
Simple reports can use existing columns and automatic aggregations. DAX becomes important when a report needs reusable business logic, custom comparisons, ratios, or context-aware calculations.
Frequently Asked Questions
What does DAX stand for?
DAX stands for Data Analysis Expressions. It is a formula language used to create calculations in Power BI, Power Pivot, and Microsoft tabular models.
Is DAX hard to learn?
Basic functions and measures are approachable. The harder part is understanding filter context, row context, relationships, and how they interact. Practical exercises make these ideas easier to understand.
Do I need DAX to use Power BI?
Not for every report. You can build basic visuals using existing columns and standard aggregations. You will need DAX for custom metrics, percentages, comparisons, time intelligence, or reusable business calculations.
Is DAX the same as SQL?
No. SQL usually works with relational databases. DAX evaluates calculations and queries over tabular data models. Many BI professionals use both.
What should I learn first?
Start with measures, column references, aggregation functions, filter context, row context, and CALCULATE(). After that, learn iterators, variables, time intelligence, and advanced filter behavior.
Can I use DAX in a regular Excel worksheet?
No. Standard worksheet formulas use Excel’s formula language. DAX is available in Excel’s data model through Power Pivot.
Where can I learn DAX for free?
Microsoft Learn provides official introductions, function references, and Power BI tutorials. Practicing with a small data model is one of the best ways to reinforce the concepts.
Is DAX useful for a data analyst career?
DAX can be valuable for roles involving Power BI, Power Pivot, or Microsoft tabular models. Its value depends on the employer’s tools and the analysis required.
Conclusion
So, what is DAX? It is the formula language that helps you turn data in a Microsoft tabular model into useful business calculations.
Measures let reports respond to filters. Calculated columns add row-level values to model tables. Time-intelligence functions support period-based comparisons, while DAX security expressions can help control which rows users are allowed to see.
You do not need to memorize hundreds of functions. Start with a simple business question, create a measure, place it in a visual, and observe how its result changes when you apply filters. Once filter context and row context make sense, more advanced DAX becomes much easier to approach.
Also Read: Google Calendar API Integration: Events, Sync, and OAuth


Fewer Tabs, Fresher Adverts: What Job Posting APIs Mean for UK Recruitment Teams
Ask any in-house recruiter or agency consultant in the UK where their week goes, and a surprising share of the…

How AI Image Generation Is Changing the Way We Create Visual Content
Creating high-quality images used to require a combination of design skills, expensive software, photography equipment, and plenty of time. Today,…